Advanced Analytics & BI
Designed for organizations that need stronger visibility, clearer performance management, and more disciplined decision-making across operations and leadership.
Example Business Cases Per Industry:
Logistics
Performance depends on speed, coordination, reliability, and cost control. Our solution helps organizations gain a clearer view of network performance and identify where execution is falling short.

Example use cases
Dashboard for on-time delivery, route compliance, trip duration, and fleet utilization
KPI reporting for warehouse productivity, order cycle time, picking accuracy, and inventory movement
Cost-to-serve analysis by route, customer, region, warehouse, or service type
Performance dashboard for delivery exceptions, failed deliveries, returns, and claim rates
Executive reporting for fuel consumption, maintenance costs, overtime, and transport cost per unit delivered
Route-efficiency reporting comparing planned vs. actual distance, stops, and turnaround time
Service-level dashboard by customer showing OTIF, lead times, incident rates, and fulfillment performance
Cross-functional reporting linking transport, warehouse, service, and cost KPIs for leadership review
Business value
Gain tighter operational visibility, reduce reporting delays, identify bottlenecks faster, and improve service and cost control across the network.
Energy
Energy organizations operate in environments where operational reliability, commercial performance, dispatch decisions, and budget discipline are tightly connected. Our solution helps leadership teams gain clearer visibility across generation, losses, maintenance, and financial performance.

Example use cases
Daily operations reporting integrating generation, outages, fuel, dispatch, and commercial indicators in one view
Executive dashboard for generation vs. budget, by plant, technology, and business unit
KPI reporting for availability, forced outages, heat rate, fuel consumption, and maintenance compliance
Loss monitoring dashboard tracking technical losses, non-technical losses, recovery rates, and collection performance
Dispatch and commercialization reporting for contracted energy, spot exposure, purchase costs, and margins
Budget variance analysis for fuel costs, operating expenses, maintenance costs, and revenue performance
Performance dashboard by asset showing output, downtime, efficiency, and contribution margin
Executive scorecard linking technical, operational, and financial KPIs for management review
Business value
Improve operational visibility, strengthen control over performance and costs, accelerate management reporting, and support more disciplined technical and commercial decisions.
Finance
Financial institutions and finance teams need more than reporting; they need disciplined visibility into profitability, risk, portfolio behavior, commercial performance, and operational efficiency. Our solution delivers the visibility and analytical foundation needed to improve decision-making, strengthen performance management, and support operational control.

Example use cases
Executive dashboard for profitability, revenue, cost ratios, liquidity, and portfolio performance
KPI monitoring for collections, delinquency buckets, recovery rates, and aging by customer or segment
Actual vs. Budget reporting by business unit, product, channel, or cost center
Portfolio dashboard showing balance evolution, churn, yield, arrears, and customer behavior trends
Commercial performance reporting for sales productivity, conversion rates, retention, and average ticket
Management reporting for cash flow, working capital, expenses, and operational efficiency indicators
Variance analysis for forecast vs. actual revenue, margin, collections, and operating costs
Business value
improve management visibility, reduce manual reporting effort, support stronger financial discipline, and help leaders make faster, better-informed commercial and portfolio decisions.
Commerce & Retail
Consumer-facing businesses require constant visibility across sales, margin, inventory, commercial execution, and customer behavior. Advanced Analytics & BI helps leadership teams respond faster and manage performance with greater precision.

Example use cases
Sales and margin dashboard by SKU, category, store, channel, region, and brand
KPI reporting for inventory turnover, stock-outs, sell-through, markdowns, and promotion performance
Executive reporting on same-store sales, basket size, average ticket, and channel profitability
Performance dashboard for promotional lift, discount depth, cannibalization, and campaign ROI
Inventory visibility by store, warehouse, product line, and replenishment status
Commercial reporting for top sellers, slow movers, excess stock, and margin erosion
Store and channel scorecards covering sales, conversion, traffic, returns, and service indicators
Price and assortment analysis to support pricing decisions, category management, and demand visibility
Business value
strengthen commercial visibility, improve inventory and pricing decisions, identify margin leakage earlier, and manage performance more proactively across channels and locations.
Pharmaceuticals & Healthcare
Organizations in pharmaceuticals and healthcare operate in environments where product availability, channel performance, regulatory discipline, and operational continuity are closely linked. Advanced Analytics & BI helps leadership teams improve visibility across commercial, supply, operational, and financial performance.

Example use cases
Dashboard tracking sales, inventory, and months of coverage by SKU, distributor, and region
KPI reporting for stock-outs, backorders, fill rate, and order cycle time by product line
Executive view of top-selling SKUs, slow movers, expired inventory, and near-expiry products
Commercial performance dashboard by product, sales force, channel, physician segment, or territory
Reporting for forecast vs. actual demand by molecule, brand, or therapeutic category
Distributor performance reporting covering sell-in, sell-out, inventory aging, and service-level compliance
Management dashboard for gross sales, returns, discounts, contribution margin, and working capital tied to inventory
Visibility into supply interruptions, critical product availability, and service failures affecting customer or patient continuity
Business value
improve product availability, strengthen distributor and channel control, reduce inventory inefficiencies, and support faster commercial and supply decisions.
Manufacturing
Manufacturing organizations need detailed visibility across production, maintenance, quality, and plant-level cost performance. Advanced Analytics & BI helps leadership teams move from retrospective reporting to tighter day-to-day operational control.

Example use cases
Dashboard for OEE, downtime, throughput, scrap rate, rework, and yield by plant, line, or shift
KPI reporting for planned vs. unplanned downtime, including root cause and lost production hours
Production dashboard comparing actual output vs. production plan by SKU, plant, or line
Maintenance reporting for work-order backlog, preventive maintenance compliance, MTBF, and MTTR
Quality dashboard for defect rate, first-pass yield, rejection rate, and claims by product line
Cost-performance analytics for labor efficiency, material waste, energy consumption, and unit production cost
Shift-by-shift performance reporting for productivity, stoppages, and quality incidents
Business value
Identify where output, efficiency, and cost performance are being lost, while improving production discipline and operational visibility across sites.

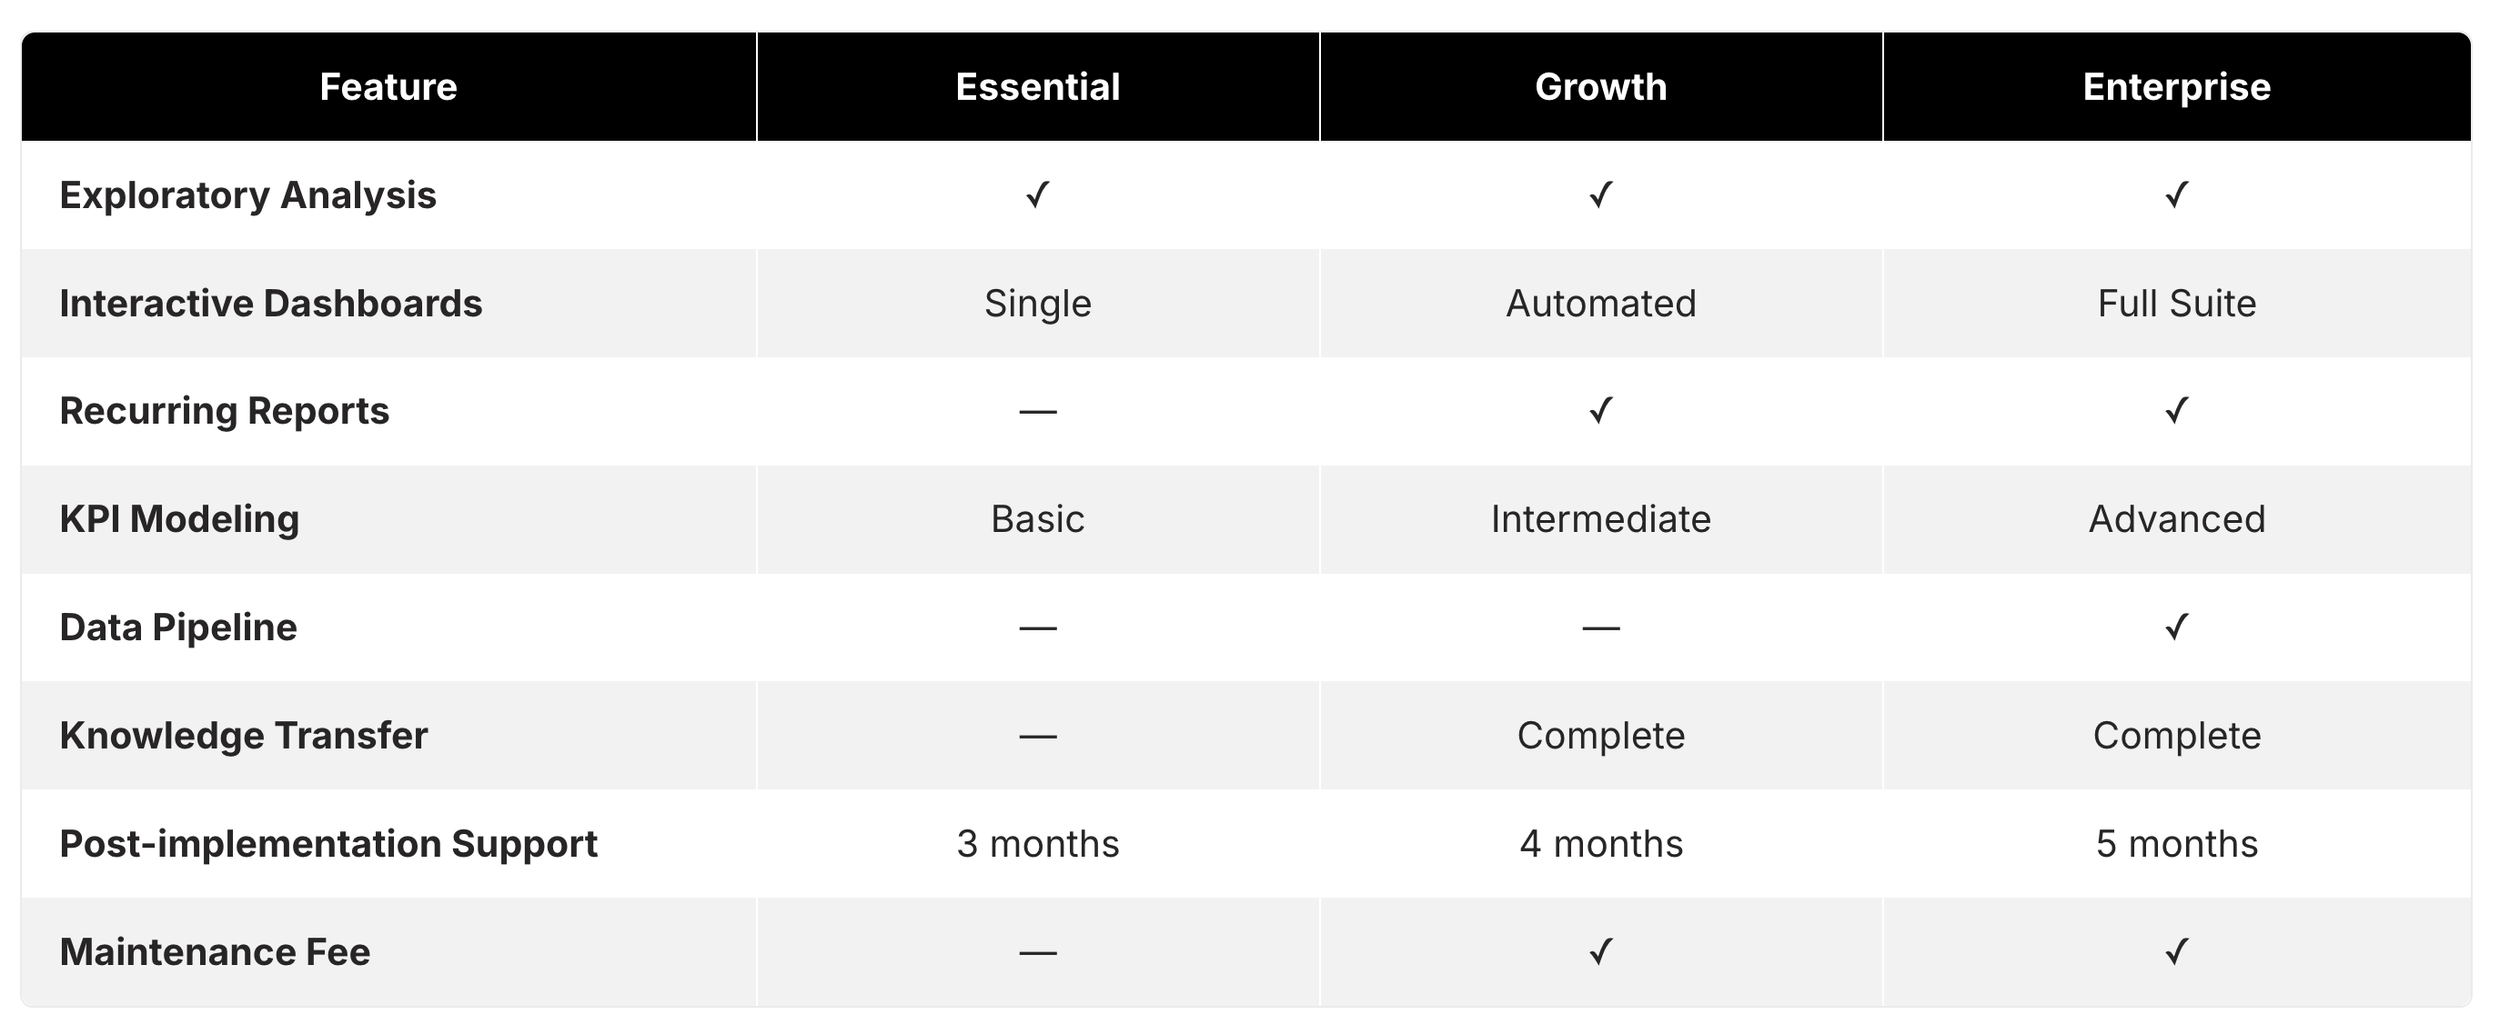
Our Plans